Home
Using HeapWalker
HeapWalker is a tool useful for evaluating Java heap contents and searching for memory leaks. It allows you to view:
- List of classes which are present on the heap. For each class you can see number of it's instances and total size of all instances.
- List of instances of each class. You can see individual instances and their size (size of instances of the same class varies only for arrays).
- Fields of each instance or class. You can browse (static) fields to identify individual instances by field values and determine dependencies among them.
- References to each instance. You can browse instances or classes holding reference to a particular instance to find unnecessary references and discover memory leaks.
Create Heap Dump
NetBeans Profiler reads HPROF Binary Format for heap dumps supported by Sun's JVMs. There are two integrated and three general ways how to generate the dumps:
- Using Dump Heap action either anytime during profiling session from Profile menu or during memory profiling as a secondary action of Take Snapshot button in Profiler Control Panel. Note: currently this is supported only for local profiling session when the profiled application runs on JDK 1.6 and above.
- Activating the OutOfMemoryError detection mechanism in Profiler section of IDE Options which enables the JVM of profiled application to dump the heap automatically on OutOfMemoryError and save it to a specified location and eventually open it in HeapWalker.
- Using
jmap command line utility available in Sun's JDK 1.5.0 and JDK 1.6.0. To create a dump run jmap command from console.
On JDK 1.6.0 use jmap -dump:format=b,file=heap.bin <pid>, on JDK 1.5.0 use jmap -heap:format=b <pid>
- Using
jconsole tool from Sun's JDK 1.6.0.
- Using
-XX:+HeapDumpOnOutOfMemoryError switch of java command to generate the dump automatically on OutOfMemoryError. This switch is available in Sun's JDK 1.6.0, JDK 1.5.0_07 (and newer) and JDK 1.4.2_12 (and newer).
More information about generating heap dumps can be found in these blogs:
- Kelly O'Hair's Blog
- Alan Bateman's Blog
- Mandy Chung's Blog
Open Heap Dump
To open a heap dump saved to project, doubleclick a heapdump listed among project's snapshots in Profiler Control Panel or select it and click the Open button. To open a heap dump from a file, use Profile | Load Heap Dump... action from IDEs menu. For each dump a new document is opened in the IDE.
Browse Heap Dump
After the dump is loaded, you can browse it using two separate views: Classes view and Instances view.
In Classes view you can see list of classes with information about number of instances and total size. You can also browse static fields of each class using Static Fields browser. To open it, click on appropriate button in the top right part of HeapWalker's toolbar.
Instances view can be opened from Classes view by doubleclicking a class or invoking Show in Instances View action in popup menu. A list of instances is displayed here for the selected class along with Fields browser and References browser.
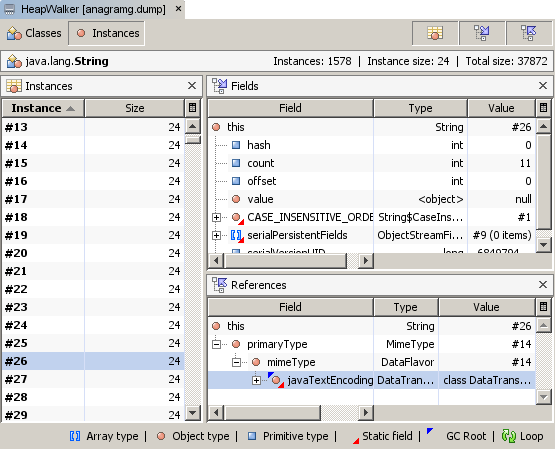
Instances view