Profiler screenshots
Screenshots of the NetBeans Profiler. Click the thumbnails to see full size images.
|
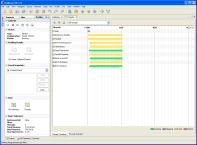
NetBeans Profiler 5.0 in NetBeans 5.0
Taken on: Windows XP
Showing: Predefined task for monitoring application
Fullsize - 1120 x 822, ~90 Kb
|

NetBeans Profiler 5.0 in NetBeans 5.0
Taken on: Windows XP
Showing: Detailed information about application threads including simple thread description
Fullsize - 1120 x 822, ~90 Kb
|
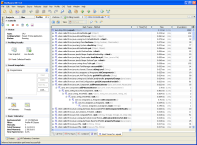
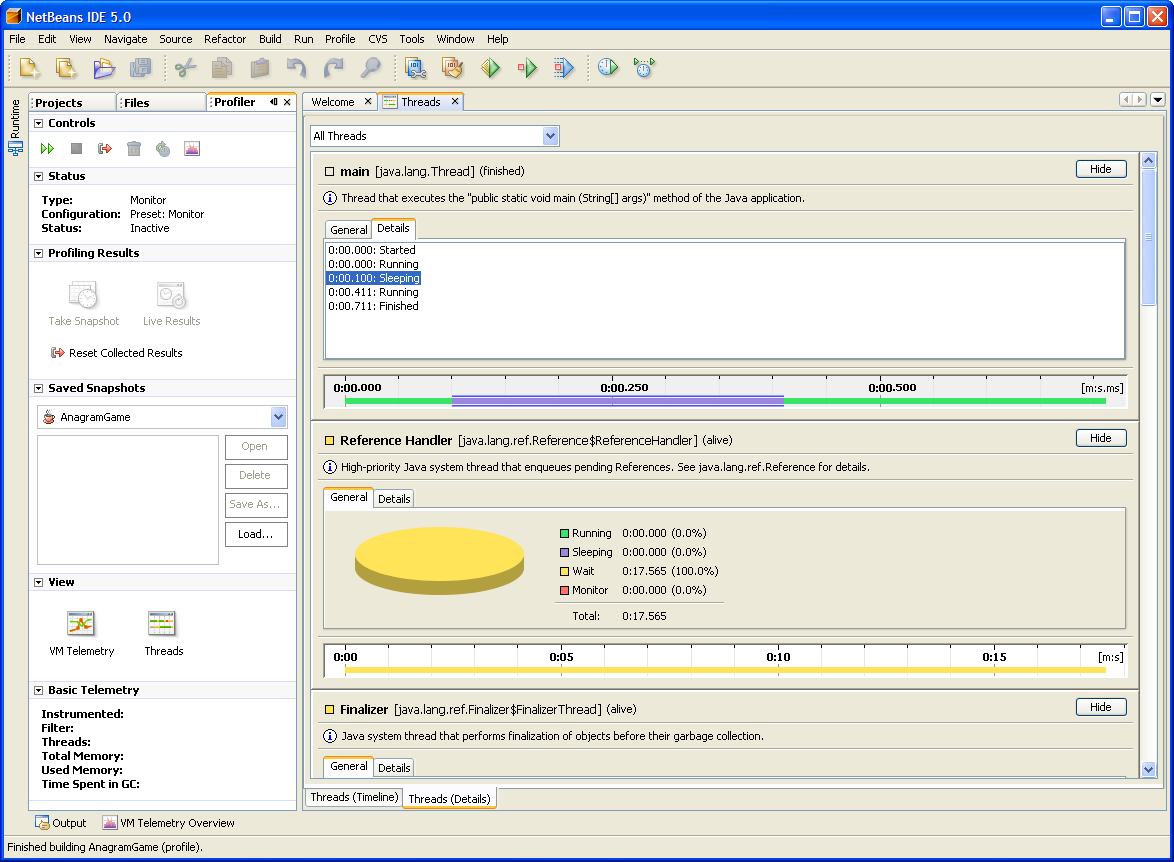
NetBeans Profiler 5.0 in NetBeans 5.0
Taken on: Windows XP
Showing: Thread states chronologically listed, interactively highlighted from timeline
Fullsize - 1120 x 822, ~90 Kb
|
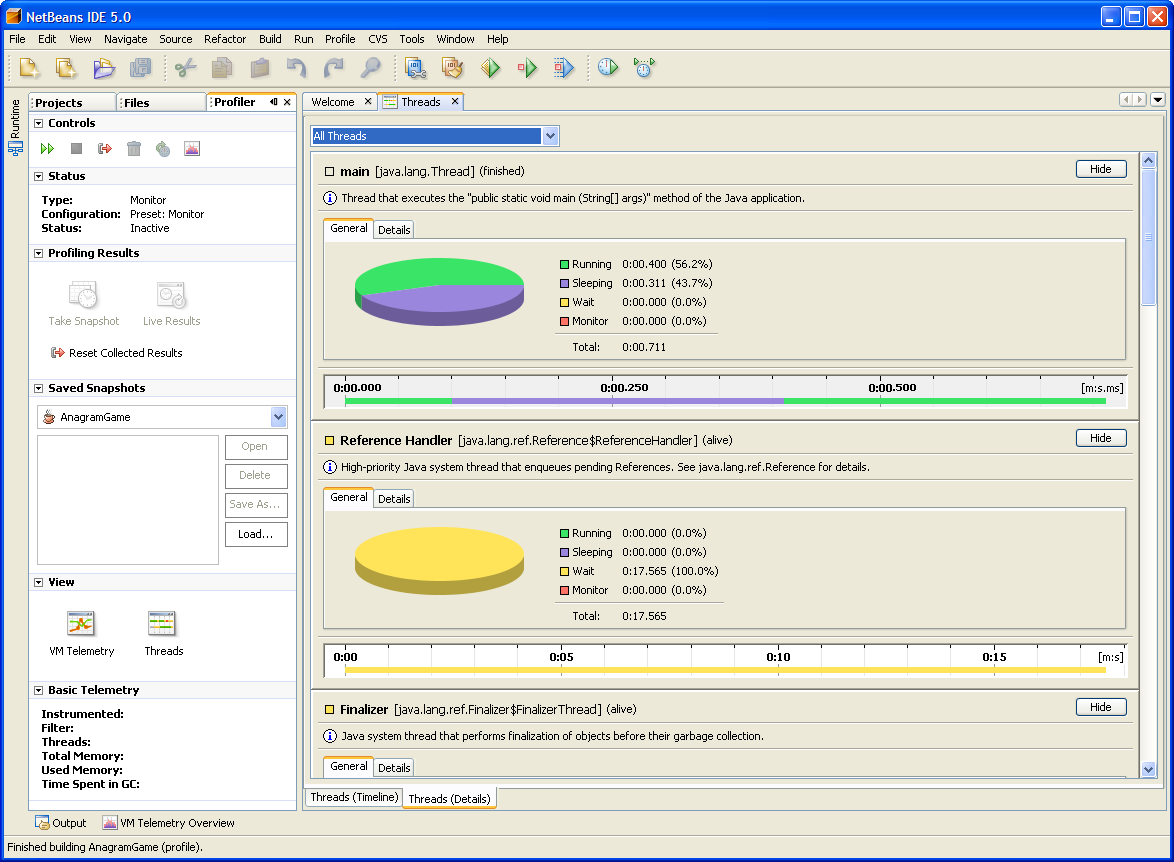
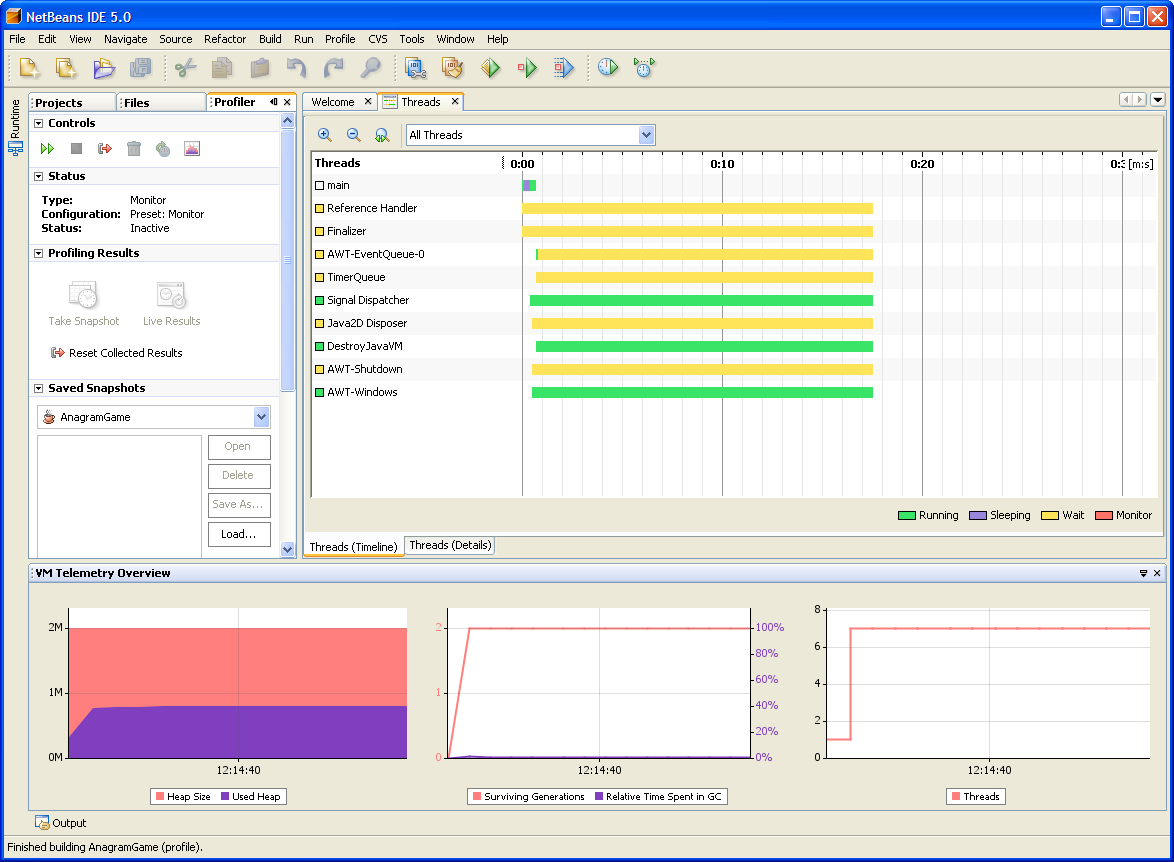
NetBeans Profiler 5.0 in NetBeans 5.0
Taken on: Windows XP
Showing: Overview of application threads
Fullsize - 1120 x 822, ~90 Kb
|
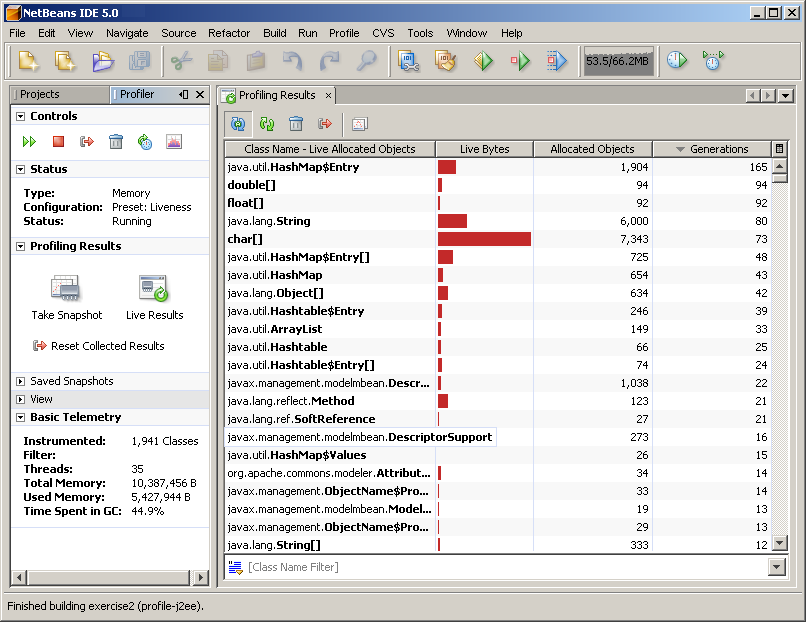
NetBeans Profiler 5.0 in NetBeans 5.0
Taken on: Windows XP
Showing: Live memory results
Fullsize - 806 x 623, ~50 Kb
|
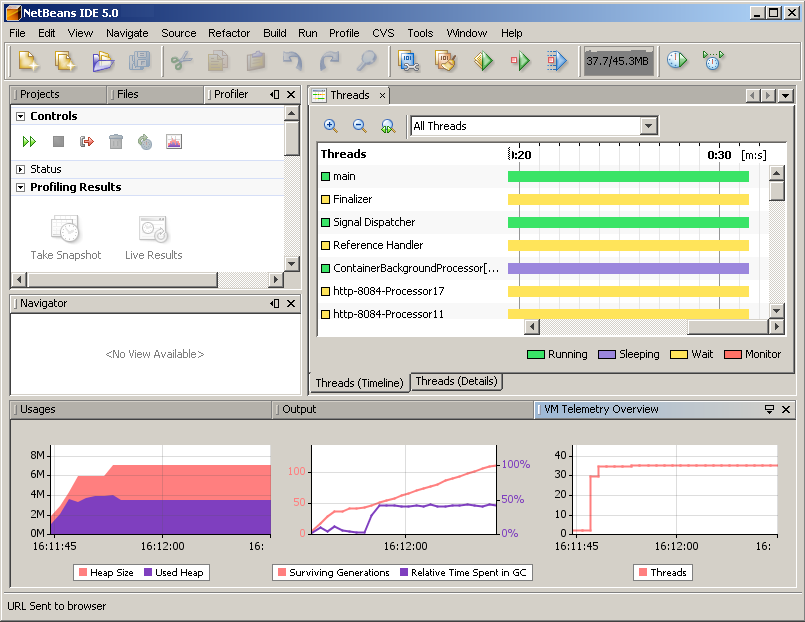
NetBeans Profiler 5.0 in NetBeans 5.0
Taken on: Windows XP
Showing: Overview of application threads and Virtual machine telemetry
Fullsize - 806 x 623, ~50 Kb
|
|
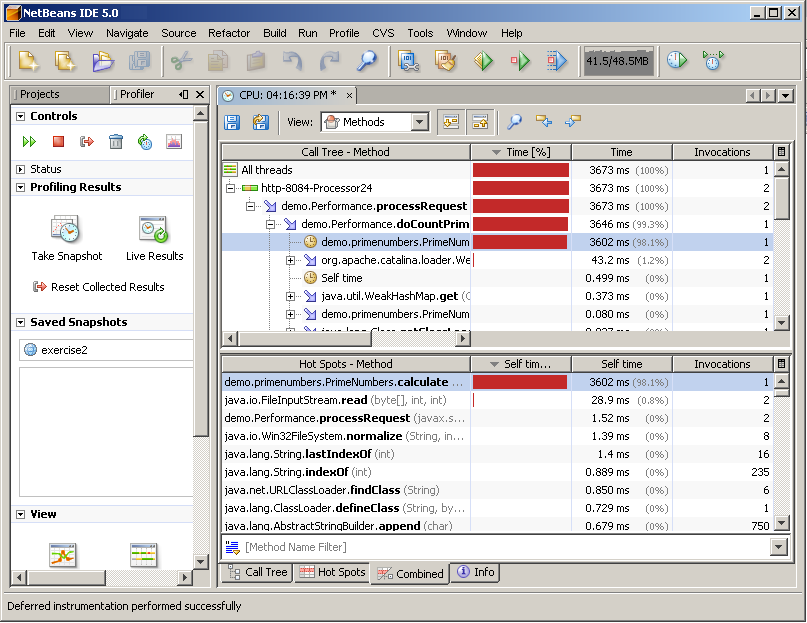
NetBeans Profiler 5.0 in NetBeans 5.0
Taken on: Windows XP
Showing: CPU snapshot, combined calltree/hotspots view
Fullsize - 806 x 623, ~50 Kb
|
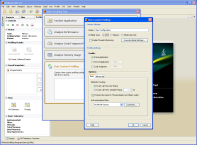
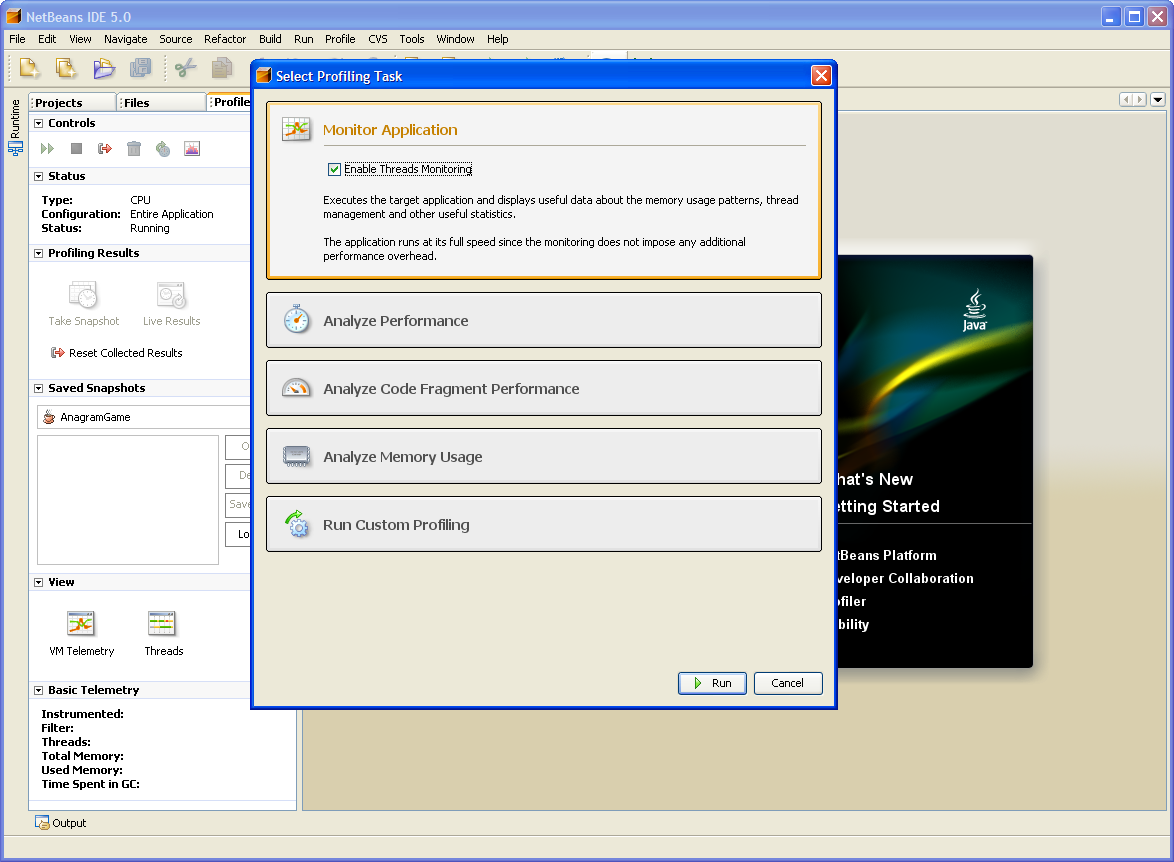
NetBeans Profiler 5.0 in NetBeans 5.0
Taken on: Windows XP
Showing: Creating custom profiling configuration
Fullsize - 1120 x 822, ~90 Kb
|
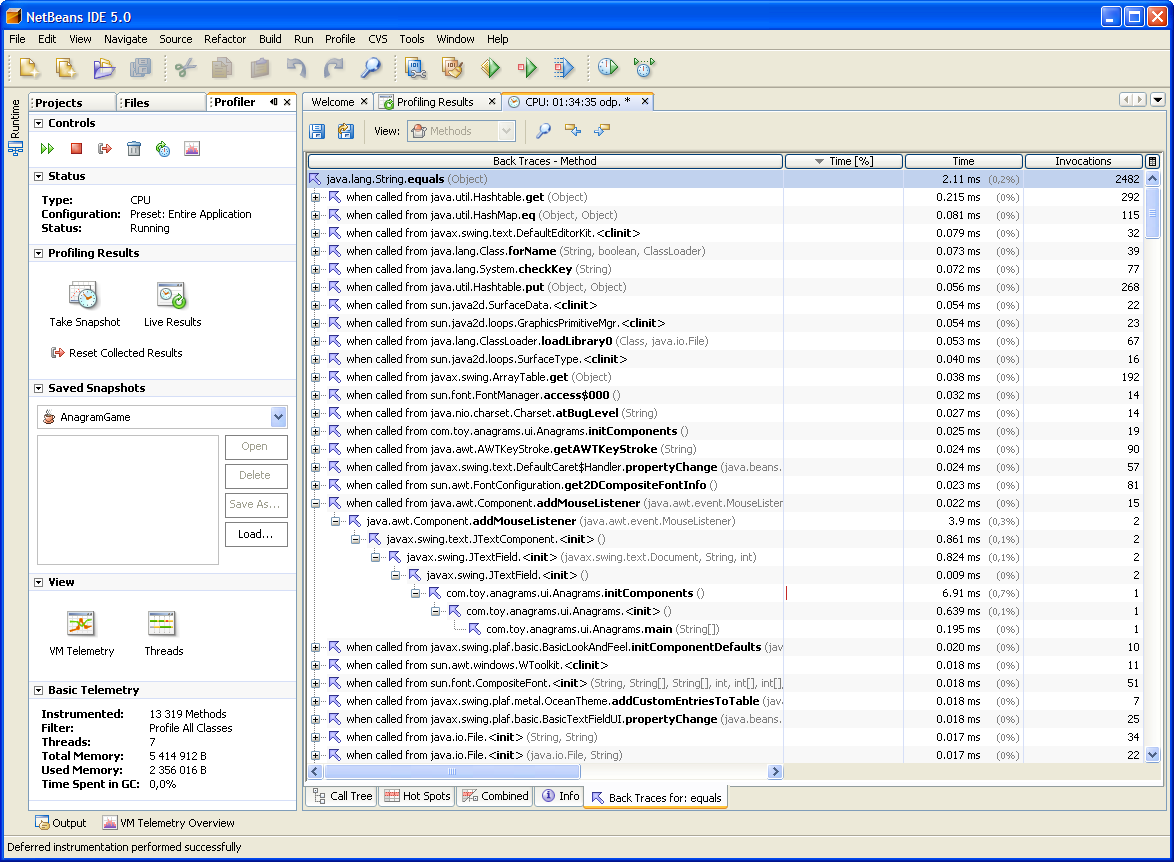
NetBeans Profiler 5.0 in NetBeans 5.0
Taken on: Windows XP
Showing: Back traces for String.equals() method
Fullsize - 1120 x 822, ~90 Kb
|
|

